一:背景
1. 讲故事
哈哈,再次见到物流类软件,上个月有位朋友找到我,说他的程序出现了 CPU 爆高,让我帮忙看下什么原因,由于那段时间在苦心研究 C++,分析和经验分享也就懈怠了,今天就给大家安排上。.
话不多说,上 windbg 说话。
二:WinDbg 分析
1. CPU 真的爆高吗
既然说 CPU 爆高,那就用 !tp 验证下。
0:000> !tp
    Method table is shared (not implemented): System.Threading.ThreadPool
CPU utilization: 81 Unknown format characterUnknown format control characterWorker Thread: Total: 203 Running: 183 Idle: 0 MaxLimit: 300 MinLimit: 150
Work Request in Queue: 0
--------------------------------------
Number of Timers: 40
--------------------------------------
Completion Port Thread:Total: 21 Free: 21 MaxFree: 80 CurrentLimit: 21 MaxLimit: 300 MinLimit: 150
从卦中看确实 CPU=81%,不过输出信息很奇怪,方法表都出错了,猜的不错应该是触发 GC 把 托管堆给关闭了,源码如下:
    GCScan::GcRuntimeStructuresValid (FALSE);
    plan_phase (n);
    GCScan::GcRuntimeStructuresValid (TRUE);
也可以用 !dumpheap -stat 来验证。
0:000> !dumpheap -stat
The garbage collector data structures are not in a valid state for traversal.
It is either in the "plan phase," where objects are being moved around, or
we are at the initialization or shutdown of the gc heap. Commands related to
displaying, finding or traversing objects as well as gc heap segments may not
work properly. !dumpheap and !verifyheap may incorrectly complain of heap
consistency errors.
Could not request method table data for object 000001E49376D520 (MethodTable: FFFFFFFFFFE026C0).
2. 为什么会触发 GC
此时我们已知道是 GC 触发,接下来可以通过 !t + !clrstack 找到那个触发 GC 的线程,通过线程栈看看正在干嘛 ?
0:000> !t
ThreadCount:      382
UnstartedThread:  0
BackgroundThread: 340
PendingThread:    0
DeadThread:       0
Hosted Runtime:   no
                                                                                                            Lock
 DBG   ID     OSID ThreadOBJ           State GC Mode     GC Alloc Context                  Domain           Count Apt Exception
   0    1     1ba4 000001E45C018C90    2a020 Preemptive  0000000000000000:0000000000000000 000001e45c368cb0 1     MTA
 297  286     2144 000001E478521200  1029220 Cooperative 0000000000000000:0000000000000000 000001e45c368cb0 0     MTA (GC) (Threadpool Worker)

0:297> !clrstack
OS Thread Id: 0x2144 (297)

        Child SP               IP Call Site
        0e 0000002f`2927ade0 00007ffa`afda2096     coreclr!WKS::gc_heap::garbage_collect+0x2a1 [e:\a\_work\191\s\src\gc\gc.cpp @ 16967]
0f 0000002f`2927aee0 00007ffa`afdbe746     coreclr!WKS::GCHeap::GarbageCollectGeneration+0x156 [e:\a\_work\191\s\src\gc\gc.cpp @ 35107]
10 (Inline Function) --------`--------     coreclr!WKS::gc_heap::try_allocate_more_space+0x1f5 [e:\a\_work\191\s\src\gc\gc.cpp @ 13197]
11 0000002f`2927af30 00007ffa`afd80c9f     coreclr!WKS::gc_heap::allocate_more_space+0x216 [e:\a\_work\191\s\src\gc\gc.cpp @ 13490]
12 (Inline Function) --------`--------     coreclr!WKS::gc_heap::allocate+0x37e [e:\a\_work\191\s\src\gc\gc.cpp @ 13521]
13 (Inline Function) --------`--------     coreclr!WKS::GCHeap::Alloc+0x3e5 [e:\a\_work\191\s\src\gc\gc.cpp @ 34419]
14 (Inline Function) --------`--------     coreclr!Alloc+0x4be [e:\a\_work\191\s\src\vm\gchelpers.cpp @ 241]
15 (Inline Function) --------`--------     coreclr!AllocateObject+0x512 [e:\a\_work\191\s\src\vm\gchelpers.cpp @ 1156]
16 0000002f`2927af90 00007ffa`51c05122     coreclr!JIT_New+0x5ff [e:\a\_work\191\s\src\vm\jithelpers.cpp @ 2810]
...
0000002F2927B228 00007ffaafd63aff [HelperMethodFrame: 0000002f2927b228]
0000002F2927B340 00007ffa51c05122 Jint.Native.Object.ObjectInstance..ctor(Jint.Engine)
0000002F2927B380 00007ffa51c058aa Jint.Native.Array.ArrayConstructor.CreateArrayConstructor(Jint.Engine)
0000002F2927B3D0 00007ffa51c0407c Jint.Engine..ctor(System.Action`1<Jint.Options>)
...
由于信息比较敏感,我就不过多的输出了,不过可以看出 GC 的引发是由于 Jint 组件,查了下资料是 JavaScript 和 .NET 用来交互的,为了进一步验证,观察下此时 GC 触发的代以及什么原因。
0:297> dx -r1 (*((coreclr!WKS::gc_mechanisms *)0x7ffab021df90))
(*((coreclr!WKS::gc_mechanisms *)0x7ffab021df90))                 [Type: WKS::gc_mechanisms]
    [+0x000] gc_index         : 0x984ab [Type: unsigned __int64]
    [+0x008] condemned_generation : 0 [Type: int]
    [+0x00c] promotion        : 1 [Type: int]
    [+0x010] compaction       : 1 [Type: int]
    [+0x014] loh_compaction   : 0 [Type: int]
    [+0x018] heap_expansion   : 0 [Type: int]
    [+0x01c] concurrent       : 0x0 [Type: unsigned int]
    [+0x020] demotion         : 1 [Type: int]
    [+0x024] card_bundles     : 1 [Type: int]
    [+0x028] gen0_reduction_count : 0 [Type: int]
    [+0x02c] should_lock_elevation : 0 [Type: int]
    [+0x030] elevation_locked_count : 0 [Type: int]
    [+0x034] elevation_reduced : 0 [Type: int]
    [+0x038] minimal_gc       : 0 [Type: int]
    [+0x03c] reason           : reason_alloc_soh (0) [Type: gc_reason]
    [+0x040] pause_mode       : pause_interactive (1) [Type: WKS::gc_pause_mode]
    [+0x044] found_finalizers : 1 [Type: int]
    [+0x048] background_p     : 0 [Type: int]
    [+0x04c] b_state          : bgc_not_in_process (0) [Type: bgc_state]
    [+0x050] allocations_allowed : 1 [Type: int]
    [+0x054] stress_induced   : 0 [Type: int]
    [+0x058] entry_memory_load : 0x0 [Type: unsigned int]
    [+0x05c] exit_memory_load : 0x0 [Type: unsigned int]
从卦中看,当前触发的是 0 代GC,触发原因是 0代 的阈值满了,这是一个很正常的 GC 操作,理应不会造成 CPU 爆高,除非是那些伤害性比较大的 FULLGC,由于没有更多的 dump 可以参考,到这里就没法更进一步确认了。
3. 还有其他线索吗
虽然 .NET 程序大多 CPU 爆高是由于 GC 的频繁触发所致,但也有其他情况,比如 CPU 密集型操作往往也会,就像我之前解读 B站的LUA死循环导致的CPU爆高场景下如何通过 火焰图 去寻找热点函数。
那这个 dump 会不会也存在这种情况呢?不管有没有,在一个 dump 的情况下也只能 死马当作活马医 了,可以用 !runaway 查查当前线程运行时间。
0:297> !runaway
 User Mode Time
  Thread       Time
  269:2354     0 days 0:07:04.171
  274:15d4     0 days 0:06:16.453
  280:1c98     0 days 0:05:32.406
  284:438      0 days 0:04:37.703
  283:183c     0 days 0:04:29.531
  282:122c     0 days 0:04:24.703
  288:2060     0 days 0:03:59.953
  286:28d0     0 days 0:03:56.640
  289:2a84     0 days 0:03:50.859
  290:1224     0 days 0:03:44.640
  291:2e4c     0 days 0:03:29.937
  292:f0c      0 days 0:03:28.656
  293:2454     0 days 0:03:26.640
  275:2810     0 days 0:03:23.828
  294:2f34     0 days 0:03:22.312
  295:24ec     0 days 0:03:17.625
  297:2144     0 days 0:03:16.609
  298:2c34     0 days 0:03:14.609
  299:2480     0 days 0:03:11.218
  ...
线程还是蛮多的,采样几个看一下,发现有很多函数与 序列化 有关。
0:269> !clrstack
OS Thread Id: 0x2354 (269)
       Child SP               IP Call Site
0000002F080FD658 00007ffacb236124 [HelperMethodFrame: 0000002f080fd658]
0000002F080FD770 00007ffab11d806b System.Runtime.Serialization.Formatters.Binary.SizedArray..ctor() [E:\A\_work\322\s\corefx\src\System.Runtime.Serialization.Formatters\src\System\Runtime\Serialization\Formatters\Binary\BinaryUtilClasses.cs @ 203]
0000002F080FD7A0 00007ffab11d6964 System.Runtime.Serialization.Formatters.Binary.BinaryParser.get_ObjectMapIdTable() [E:\A\_work\322\s\corefx\src\System.Runtime.Serialization.Formatters\src\System\Runtime\Serialization\Formatters\Binary\BinaryParser.cs @ 57]
0000002F080FD7E0 00007ffa515132c1 System.Runtime.Serialization.Formatters.Binary.BinaryParser.ReadObjectWithMapTyped(System.Runtime.Serialization.Formatters.Binary.BinaryObjectWithMapTyped) [E:\A\_work\322\s\corefx\src\System.Runtime.Serialization.Formatters\src\System\Runtime\Serialization\Formatters\Binary\BinaryParser.cs @ 532]
0000002F080FD8B0 00007ffab11d74ed System.Runtime.Serialization.Formatters.Binary.BinaryParser.ReadObjectWithMapTyped(System.Runtime.Serialization.Formatters.Binary.BinaryHeaderEnum) [E:\A\_work\322\s\corefx\src\System.Runtime.Serialization.Formatters\src\System\Runtime\Serialization\Formatters\Binary\BinaryParser.cs @ 504]

0:280> !clrstack
OS Thread Id: 0x1c98 (280)
       Child SP               IP Call Site
0000002F185FCE38 00007ffacb236124 [HelperMethodFrame: 0000002f185fce38]
0000002F185FCF30 00007ffaaf59bb61 System.String.Ctor(Char[], Int32, Int32) [E:\A\_work\191\s\src\mscorlib\shared\System\String.cs @ 79]
0000002F185FCF90 00007ffa5033f984 Newtonsoft.Json.JsonTextReader.ParseReadString(Char, Newtonsoft.Json.ReadType)
0000002F185FD040 00007ffa5099cd0b Newtonsoft.Json.JsonTextReader.ReadStringValue(Newtonsoft.Json.ReadType)
0000002F185FD0B0 00007ffa5099cb0e Newtonsoft.Json.JsonTextReader.ReadAsString()
0000002F185FD0E0 00007ffa514c68fc Newtonsoft.Json.JsonReader.ReadForType(Newtonsoft.Json.Serialization.JsonContract, Boolean)

0:284> !clrstack
OS Thread Id: 0x438 (284)
       Child SP               IP Call Site
0000002F1ED7C9C8 00007ffacb236124 [RedirectedThreadFrame: 0000002f1ed7c9c8]
0000002F1ED7CA48 00007ffaaf5a6863 System.Buffer.Memmove(Byte*, Byte*, UInt64) [E:\A\_work\191\s\src\mscorlib\src\System\Buffer.cs @ 211]
0000002F1ED7CA50 00007ffaaf59bbb2 System.String.Ctor(Char[], Int32, Int32) [E:\A\_work\191\s\src\mscorlib\shared\System\String.cs @ 83]
0000002F1ED7CAB0 00007ffa5033f984 Newtonsoft.Json.JsonTextReader.ParseReadString(Char, Newtonsoft.Json.ReadType)
0000002F1ED7CB60 00007ffa5099cd0b Newtonsoft.Json.JsonTextReader.ReadStringValue(Newtonsoft.Json.ReadType)
0000002F1ED7CBD0 00007ffa5099cb0e Newtonsoft.Json.JsonTextReader.ReadAsString()
有了线索之后,接下来用 ~*e !clrstack 把所有的线程栈调出来,发现很多的 JsonConvert ,并且还有 5 个线程在做 DeepClone,截图如下:
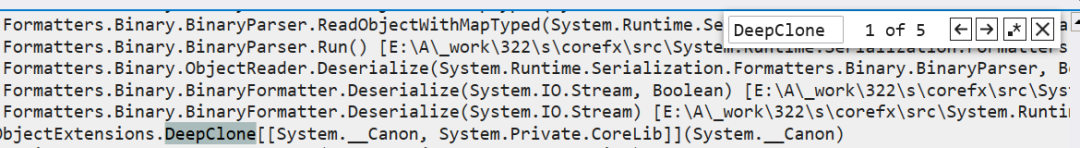
接下来把 DeepClone 函数导出来看看,发现是用 BinaryFormatter 来实现对象的深复制。
public static T DeepClone<T>(this T obj) where T : class
{
 BinaryFormatter binaryFormatter = new BinaryFormatter();
 using MemoryStream memoryStream = new MemoryStream();
 binaryFormatter.Serialize(memoryStream, obj);
 memoryStream.Seek(0L, SeekOrigin.Begin);
 return (T)binaryFormatter.Deserialize(memoryStream);
}
把发现的这些线索反馈给朋友后,确实也验证了是 序列化 造成的。

三:总结
分析完毕,这个 dump 给我们的教训是:
-
对象的深复制慎用
BinaryFormatter这种流式操作,尤其是在大对象的情况下,它是一种 CPU 密集性的,建议采用 AutoMapper 这类 带 ILEmit, ExpressionTree 还带编译缓存的开源工具包。 -
高级调试是一场破案之旅,你第一眼看到的往往是程序故意让你看到的,需要不断的积累破案经验练就一双慧眼。