dotnet-monitor可以在Kubernetes中作为Sidecar运行,Sidecar是一个容器,它与应用程序在同一个Pod中运行,利用Sidecar模式使我们可以诊断及监控应用程序。
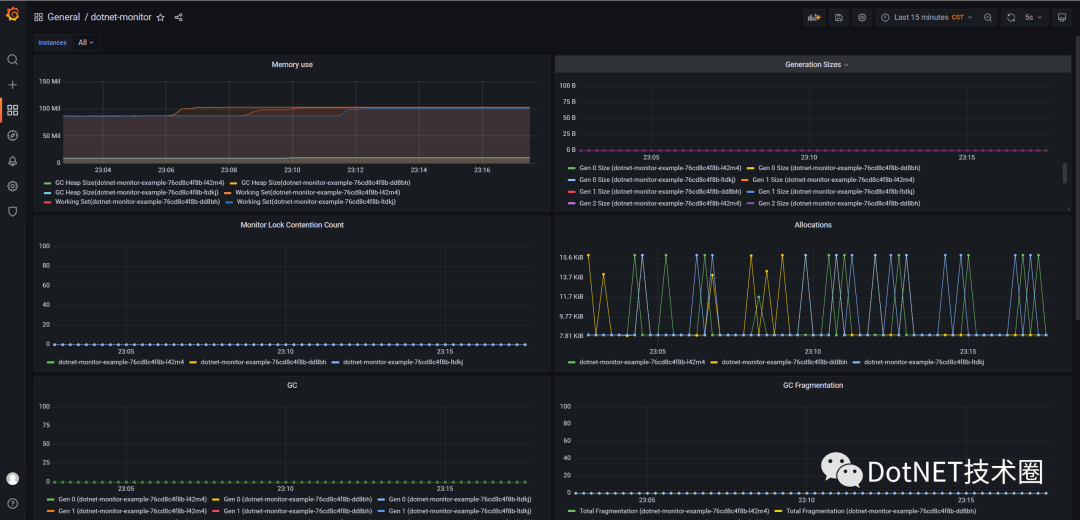
如下图所示,这是我们最终要实现的目标,通过可视化界面查看应用程序的指标信息。.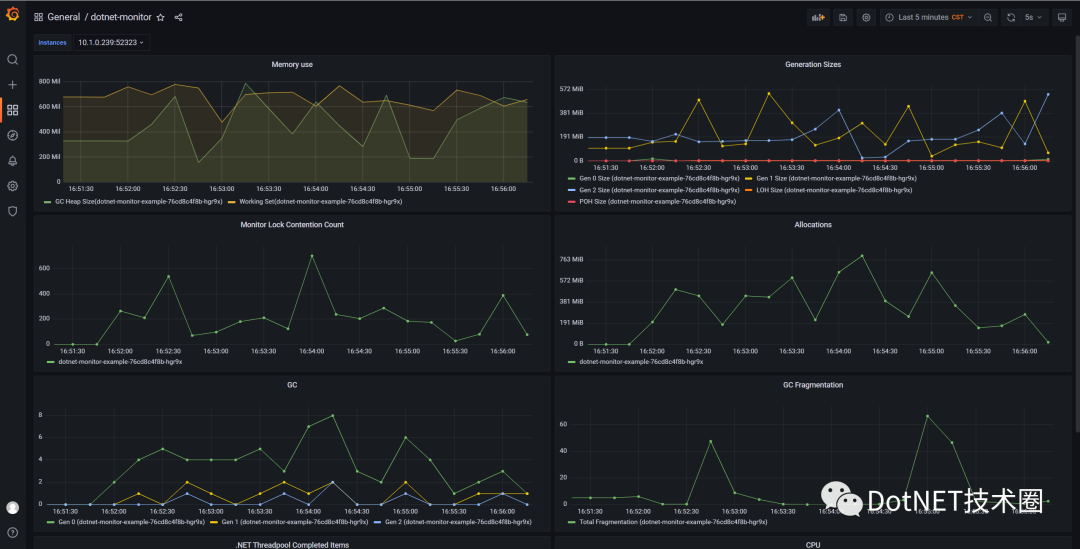
应用服务
创建dotnetmonitor.yaml文件,如下所示。
apiVersion: apps/v1
kind: Deployment
metadata:
  name: dotnet-monitor-example
spec:
  replicas: 3
  selector:
    matchLabels:
      app: dotnet-monitor-example
  template:
    metadata:
      annotations:
        prometheus.io/scrape: 'true'
        prometheus.io/port: "52325"
      labels:
        app: dotnet-monitor-example
    spec:
      containers:
        - name: server
          image: mcr.microsoft.com/dotnet/core/samples:aspnetapp
          ports:
            - containerPort: 80
          volumeMounts:
            - mountPath: /tmp
              name: tmp
        - name: sidecar
          image: mcr.microsoft.com/dotnet/monitor
          ports:
            - containerPort: 52323
          resources:
            requests:
              cpu: 50m
              memory: 32Mi
            limits:
              cpu: 250m
              memory: 256Mi
          args: ["--no-auth"]
          env:
            - name: DOTNETMONITOR_Urls
              value: "http://+:52323"
          volumeMounts:
            - name: tmp
              mountPath: /tmp
      volumes:
        - name: tmp
          emptyDir: {}
Sidecar和应用程序共享tmp目录,同时将目录映射到emptyDir类型的 Volume中。接下来,创建dotnetmonitor-service.yaml,为应用程序和Sidecar开放端口。
apiVersion: v1
kind: Service
metadata:
  name: dotnetmonitor
  labels:
    app: dotnetmonitor
spec:
  type: NodePort
  ports:
    - name: sidecar
      protocol: TCP
      port: 52323
      nodePort: 31623
    - name: app
      protocol: TCP
      port: 80
      nodePort: 31624
  selector:
    app: dotnet-monitor-example
Prometheus配置
创建prometheus-config.yaml文件,通过ConfigMaps管理Prometheus的配置文件,并写入如下内容。
apiVersion: v1
kind: ConfigMap
metadata:
  name: prometheus-config
data:
  prometheus.yaml: |
    global:
      scrape_interval:     2s
      evaluation_interval: 2s
    scrape_configs:
      - job_name: 'prometheus'
        static_configs:
        - targets: ['localhost:9090']
      - job_name: default/dotnet-monitor-example/0
        honor_timestamps: true
        scrape_interval: 10s
        scrape_timeout: 10s
        metrics_path: /metrics
        scheme: http
        follow_redirects: true
        relabel_configs:
          # 使用 Label "__meta_kubernetes_pod_container_name" 的值
        - source_labels: [__meta_kubernetes_pod_container_name]
          separator: ;
          # 正则表达式,用于匹配源标签值使用的
          regex: sidecar
          # replacement指定的替换后的标签(target_label)对应的数值
          replacement: $1
          # keep就是保留符合正则表达式targets,并显示出来
          action: keep
        - source_labels: [__meta_kubernetes_pod_annotation_prometheus_io_scrape]
          action: keep
          regex: true
        - source_labels: [__meta_kubernetes_pod_name]
          action: replace
          target_label: pod
        kubernetes_sd_configs:
        - role: endpoints
          follow_redirects: true
          namespaces:
            names:
            - default
在Prometheus中如果采用静态服务发现(static_configs)模式注册,那么HPA(HorizontalPodAutoscaler,Pod水平自动伸缩)的变动会导致服务很难快速的注册,如果频繁更改配置文件,那么也是得不偿失的,所以,在此处选择kubernetes服务发现(kubernetes_sd_configs)模式,除此之外Prometheus还支持其他方式的服务发现。
-
static_configs: 静态服务发现
-
dns_sd_configs: DNS 服务发现
-
file_sd_configs: 文件服务发现
-
kubernetes_sd_configs: Kubernetes 服务发现
-
gce_sd_configs: GCE 服务发现
-
ec2_sd_configs: EC2 服务发现
-
openstack_sd_configs: OpenStack 服务发现
-
azure_sd_configs: Azure 服务发现
现在,意味着我们会在Kubernetes中的会保留__meta_kubernetes_pod_container_name值为sidecar的,同时也需要满足__meta_kubernetes_pod_annotation_prometheus_io_scrape属性为true的Pod。
接下来,创建prometheus-rbac-setup.yaml文件,为了使Prometheus可以访问到Kubernetes API,我们需要对Prometheus进行访问授权,在Kubernetes中通过基于角色的访问控制模型(Role-Based Access Control),用于访问Kubernetes的资源。首先我们定义角色(ClusterRole)并设置相应的访问权限;为Prometheus创建账号(ServiceAccount);最后将账号与角色进行绑定(ClusterRoleBinding)。
apiVersion: rbac.authorization.k8s.io/v1
kind: ClusterRole
metadata:
  name: prometheus
rules:
- apiGroups: [""]
  resources:
  - nodes
  - nodes/proxy
  - services
  - endpoints
  - pods
  verbs: ["get", "list", "watch"]
- apiGroups:
  - extensions
  resources:
  - ingresses
  verbs: ["get", "list", "watch"]
- nonResourceURLs: ["/metrics"]
  verbs: ["get"]
---
apiVersion: v1
kind: ServiceAccount
metadata:
  name: prometheus
  namespace: default
---
apiVersion: rbac.authorization.k8s.io/v1
kind: ClusterRoleBinding
metadata:
  name: prometheus
roleRef:
  apiGroup: rbac.authorization.k8s.io
  kind: ClusterRole
  name: prometheus
subjects:
- kind: ServiceAccount
  name: prometheus
  namespace: default
创建prometheus-deployment.yaml文件。
apiVersion: apps/v1
kind: Deployment
metadata:
  labels:
    name: prometheus
  name: prometheus
spec:
  replicas: 1
  selector:
    matchLabels:
      app: prometheus
  template:
    metadata:
      labels:
        app: prometheus
    spec:
      serviceAccountName: prometheus
      containers:
      - name: prometheus
        image: prom/prometheus:latest
        command:
        - "/bin/prometheus"
        args:
        - "--config.file=/etc/prometheus/prometheus.yml"
        ports:
        - containerPort: 9090
          protocol: TCP
        volumeMounts:
        - mountPath: "/etc/prometheus"
          name: prometheus-config
      volumes:
      - name: prometheus-config
        configMap:
          name: prometheus-config
创建prometheus-service.yaml文件。
apiVersion: v1
kind: Service
metadata:
  name: prometheus
  labels:
    name: prometheus
spec:
  type: NodePort
  ports:
  - name: prometheus
    protocol: TCP
    port: 9090
    targetPort: 9090
    nodePort: 32732
  selector:
    app: prometheus
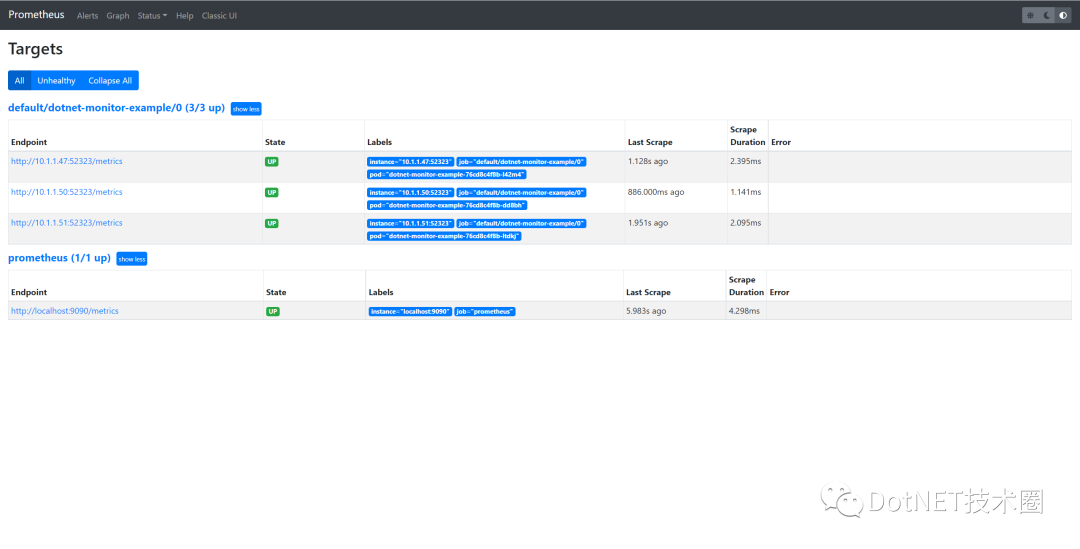
如下所示,展示了Prometheus仪表盘
Grafana
Grafana的内容不做展开了,当然你可以直接查看或使用我的dashboard文件。
https://github.com/hueifeng/dotnet-monitor-on-k8s
参考
部署Prometheus
https://dotnetos.org/blog/2021-11-22-dotnet-monitor-grafana/