一:背景
1.讲故事
上个月 .NET调试训练营 里的一位老朋友给我发了一个 8G 的dump文件,说他的程序内存泄露了,一时也没找出来是哪里的问题,让我帮忙看下到底是怎么回事,毕竟有了一些调试功底也没分析出来,说明还是有一点复杂的,现实世界中的dump远比课上说的复杂的多。
还是那句话,找我分析是免费的,没有某软高额的工时费,接下来我们上 WinDbg 说话。.
二:WinDbg 分析
1. 托管还是非托管泄露
这是我们首先就要做出的抉择,否则就会南辕北辙,可以使用 !address -summary & !eeheap -gc 来定位一下。
0:000> !address -summary

--- Usage Summary ---------------- RgnCount ----------- Total Size -------- %ofBusy %ofTotal
Free                                   1311     7ffc`e2b37000 ( 127.988 TB)           99.99%
<unknown>                              4799        2`4f798000 (   9.242 GB)  74.19%    0.01%
Heap                                   3029        0`906fe000 (   2.257 GB)  18.12%    0.00%
Image                                  3435        0`2b530000 ( 693.188 MB)   5.43%    0.00%
Stack                                   226        0`11e00000 ( 286.000 MB)   2.24%    0.00%
Other                                    90        0`0025c000 (   2.359 MB)   0.02%    0.00%
TEB                                      75        0`00096000 ( 600.000 kB)   0.00%    0.00%
PEB                                       1        0`00001000 (   4.000 kB)   0.00%    0.00%

--- Type Summary (for busy) ------ RgnCount ----------- Total Size -------- %ofBusy %ofTotal
MEM_PRIVATE                            7990        2`e6964000 (  11.603 GB)  93.14%    0.01%
MEM_IMAGE                              3445        0`2b536000 ( 693.211 MB)   5.43%    0.00%
MEM_MAPPED                              220        0`0b61f000 ( 182.121 MB)   1.43%    0.00%

--- State Summary ---------------- RgnCount ----------- Total Size -------- %ofBusy %ofTotal
MEM_FREE                               1311     7ffc`e2b37000 ( 127.988 TB)           99.99%
MEM_COMMIT                             8158        1`cf52a000 (   7.239 GB)  58.11%    0.01%
MEM_RESERVE                            3497        1`4df8f000 (   5.218 GB)  41.89%    0.00%

0:000> !eeheap -gc
Number of GC Heaps: 1
generation 0 starts at 0x0000023ba303e940
generation 1 starts at 0x0000023ba2ebd0d0
generation 2 starts at 0x00000239a80f1000
ephemeral segment allocation context: none
...
Large object heap starts at 0x00000239b80f1000
         segment             begin         allocated              size
00000239b80f0000  00000239b80f1000  00000239bfe174a8  0x7d264a8(131228840)
0000023a6f050000  0000023a6f051000  0000023a73780800  0x472f800(74643456)
Total Size:              Size: 0xea9878f8 (3935860984) bytes.
------------------------------
GC Heap Size:            Size: 0xea9878f8 (3935860984) bytes.
从卦中的 MEM_COMMIT 和 GC Heap Size 这两个指标来看,主要还是托管内存泄露,虽然非托管内存也不小,大概率还是托管这边导致的,有了这些信息之后,后面就是看下 托管堆 到底都是些什么对象。
0:000> !dumpheap -stat
Statistics:
              MT    Count    TotalSize Class Name
...
00007ffa2d7a1080  4923008    118152192 System.WeakReference
00007ffa2d725e70  2224022    125834760 System.Object[]
00007ffa2701de10  1044218    133659904 System.Windows.Documents.Paragraph
00007ffa2706b470  1045023    142123128 System.Windows.Documents.Run
00007ffa2706a9b0  2098480    151090560 System.Windows.Documents.TextTreeTextNode
00007ffa2d7267d0  1138661    159949302 System.Char[]
00007ffa2d7259c0  1231039    160962948 System.String
00007ffa29580cd8      214    165608376 MS.Internal.WeakEventTable+EventKey[]
00007ffa2d729750  2116556    169324480 System.Collections.Hashtable
00007ffa2d724478  2117718    209740224 System.Collections.Hashtable+bucket[]
00007ffa2706eb08  4175733    367464504 System.Windows.Documents.TextTreeTextElementNode
00007ffa2700ca48  2088016    384194944 System.Windows.ResourceDictionary
00007ffa2957fdc8  2344569    405666920 System.Windows.EffectiveValueEntry[]
从卦中的 TotalSize 来看并没有明显的特征,但从 Count 看还是有一些蛛丝马迹的,比如 System.Windows.Documents.TextTreeTextElementNode 对象为什么高达 417w ? 为什么 System.Windows.Documents.TextTreeTextNode 有 209w ?虽然都是 WPF 框架的内部类,但从名字上看貌似和 文本类 控件有关系。
2. TextTreeTextElementNode 为什么没被回收
有了这些可疑信息,接下来就需要看下他们为什么没有被 GC 收掉?要想找到答案就需要抽几个 TextTreeTextElementNode 看下用户根是什么?可以使用 !dumpheap -mt xxx 找到 address 之后再用 !gcroot 观察一下。
0:000> !dumpheap -mt 00007ffa2706eb08
         Address               MT     Size
00000239a815f028 00007ffa2706eb08       88
00000239a815f080 00007ffa2706eb08       88
00000239a815f2e8 00007ffa2706eb08       88
00000239a815f340 00007ffa2706eb08       88
00000239a8259f18 00007ffa2706eb08       88
...

0:000>  !gcroot 0000023a637180e0
 !gcroot 0000023a637180e0
Thread e6c:
    000000aebe7fec20 00007ffa296c0298 System.Windows.Threading.Dispatcher.GetMessage(System.Windows.Interop.MSG ByRef, IntPtr, Int32, Int32)
        rsi:
            ->  00000239a8101688 System.Windows.Threading.Dispatcher
            ->  0000023b4630e9a8 System.EventHandler
            ->  0000023b4630a990 System.Object[]
            ->  00000239a8425648 System.EventHandler
                ...
结果刷了半天都没刷完,还把 windbg 给弄死了,看样子这个引用链得有几十万哈。。。截图如下:
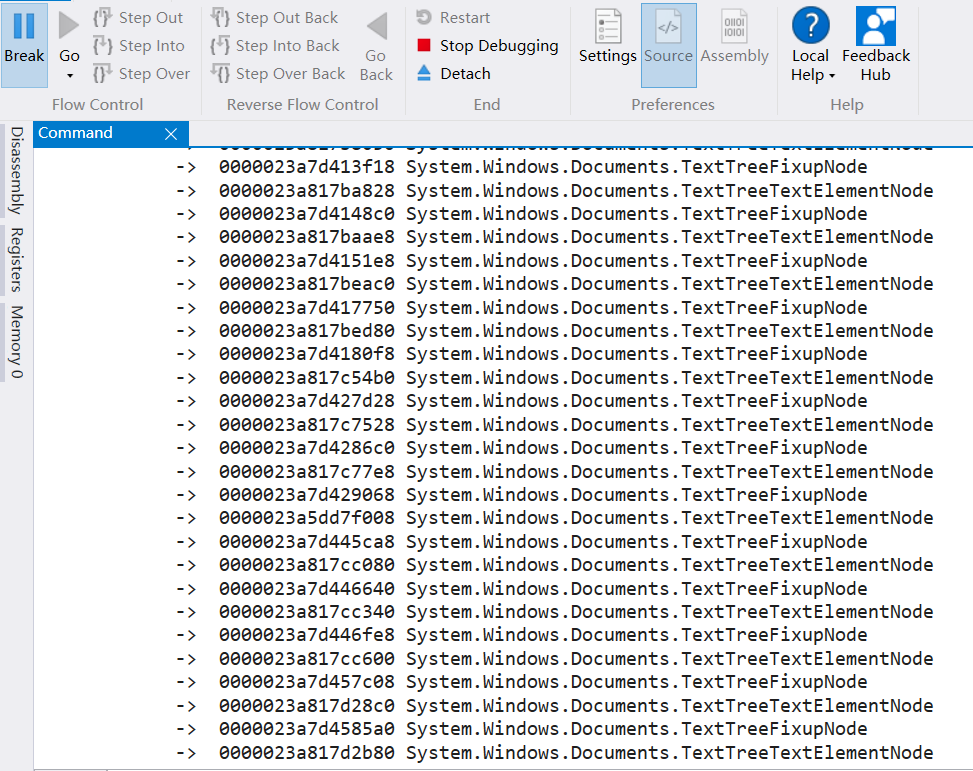
那遇到这种情况怎么办呢?为了能够记录到所有的引用链,大家可以用 windbg 的 .logopen 和 .logclose 命令将所有的输出记录到文本中,喝了杯咖啡之后,终于output完了,看文件有 81w 行,真的心累。
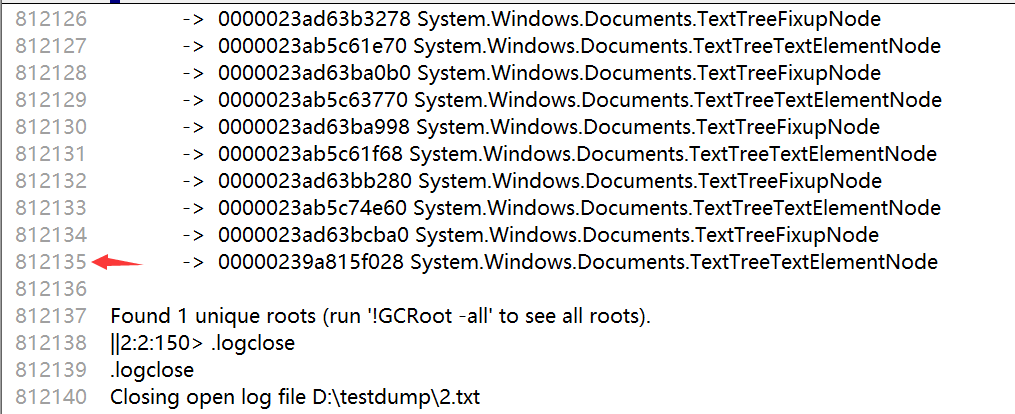
一眼望去大多是 TextTreeTextElementNode 和 TextTreeFixupNode 之间的交叉引用,还得耐点心慢慢往上翻,看看可有什么蛛丝马迹,经过仔细排查,发现有一个 RickTextBox 控件,截图如下:
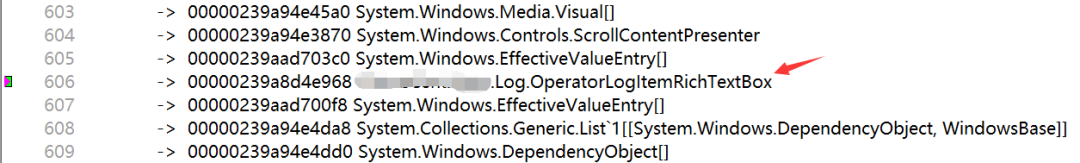
从名字上来看,可能是想用 RichTextBox 记录日志,接下来看下 OperatorLogItemRichTextBox 这个类是怎么写的。
public sealed class OperatorLogItemRichTextBox : RichTextBox, IOperatorLogger
{
    private static readonly DependencyProperty MaximumLogCountProperty = DependencyProperty.Register("MaximumLogCount", typeof(int), typeof(OperatorLogItemRichTextBox), new PropertyMetadata(1024));

    private static readonly DependencyProperty VerboseBrushProperty = DependencyProperty.Register("VerboseBrush", typeof(Brush), typeof(OperatorLogItemRichTextBox), new PropertyMetadata(Brushes.Gray));

    private static readonly DependencyProperty DebugBrushProperty = DependencyProperty.Register("DebugBrush", typeof(Brush), typeof(OperatorLogItemRichTextBox), new PropertyMetadata(Brushes.Cyan));

    ...

    private static readonly DependencyProperty ExceptionBrushProperty = DependencyProperty.Register("ExceptionBrush", typeof(Brush), typeof(OperatorLogItemRichTextBox), new PropertyMetadata(Brushes.Magenta));

    private static readonly DependencyProperty SpecialBrushProperty = DependencyProperty.Register("SpecialBrush", typeof(Brush), typeof(OperatorLogItemRichTextBox), new PropertyMetadata(Brushes.Magenta));

    ...
}
从源码看,朋友在项目中实现了一个自定义的 RichTextBox 控件来实现日志记录,内存泄露问题应该就在这里。
有车的朋友都知道 4S 店有一个好的传统,那就是 只换不修,又简单又能轻松挣钱,所以我给朋友的建议是:把 OperatorLogItemRichTextBox 从项目中给踢掉,排查下还有没有内存泄露的问题。
终于在一周后,收到了朋友的反馈,问题也终于解决了,截图如下:

三:总结
其实关于 RichTextBox 的问题我遇到过二次,上次是崩溃相关的,如果要用它来记录日志,建议还是用信得过的第三方富文本控件,自己实现的话,难免会踩到很多坑。