大家好,我是宝弟!
今天给大家推荐一个基于blazor技术,使用C#编写的web前端charts组件。blazor-charts。目前Blazor中可用的图表组件库无不例外的采用的JS库进行二次分装,基本实现方式雷同。但Blazor技术将C#带到了前端,我们却继续使用着JS的图表库,这明显是不合理的。所以blazor-charts诞生了。.
完全使用C#语言编写
使用Razor语法定义图表
图表组件灵活组合使用
柱状图

折线图

面积图

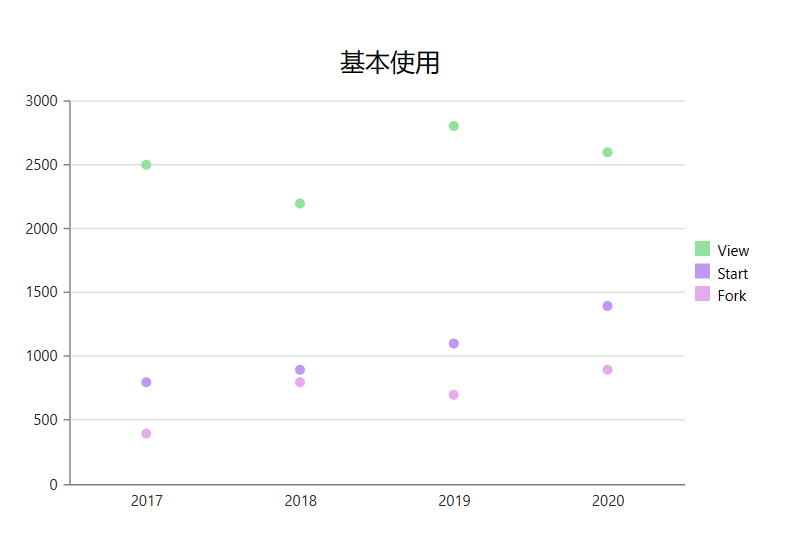
散点图
安装依赖:
dotnet add package BlazorCharts --version 0.4.108或者
PM> NuGet\Install-Package BlazorCharts添加引用
@using BlazorCharts在页面中使用
<BcChart Height="600" Width="800" Data="DemoData.Githubs" CategoryField="x=>x.Year.ToString()"><BcTitle Title="图表示例" TData="Github"></BcTitle><BcAxesY TData="Github" GridLineMajor="true" GridLineMinor="true"></BcAxesY><BcLegend TData="Github" BorderWidth="1" Position="LegendPosition.Bottom"></BcLegend><BcColumnSeries TData="Github" ValueFunc="x=>x.Sum(y=>y.View)" GroupName="View"></BcColumnSeries><BcColumnSeries TData="Github" ValueFunc="x=>x.Sum(y=>y.Start)" GroupName="Start"></BcColumnSeries><BcLineSeries TData="Github" ValueFunc="x=>x.Sum(y=>y.Fork)" GroupName="Fork" IsSecondaryAxis="true"></BcLineSeries></BcChart>
string title = "图表示例";List<Github> githubs = new List<Github>(){new Github(){Year=2017,View =2500,Start=800,Fork=400},new Github(){Year=2018,View =2200,Start=900,Fork=800},new Github(){Year=2019,View =2800,Start=1100,Fork=700},new Github(){Year=2020,View =2600,Start=1400,Fork=900},};public class Github{public int Year { get; set; }public int View { get; set; }public int Start { get; set; }public int Fork { get; set; }}
资源获取方式
https://github.com/TimChen44/blazor-charts