你好,这里是 Dotnet 工具箱,定期分享 Dotnet 有趣,实用的工具和组件,希望对您有用!
LiveCharts2 是一个简单、灵活、交互式以及功能强大的跨平台图表库。.

LiveCharts2 现在几乎可以在任何地方运行,包括 Maui、Uno Platform、Blazor-wasm、WPF、WinForms、Xamarin、Avalonia、WinUI、UWP。

LiveCharts2 (v2) 是LiveCharts (v0)的演变,它修复了其前身的主要设计问题,它专注于在任何地方运行,在不丢失在 v0 中已有的东西的情况下提高了灵活性。
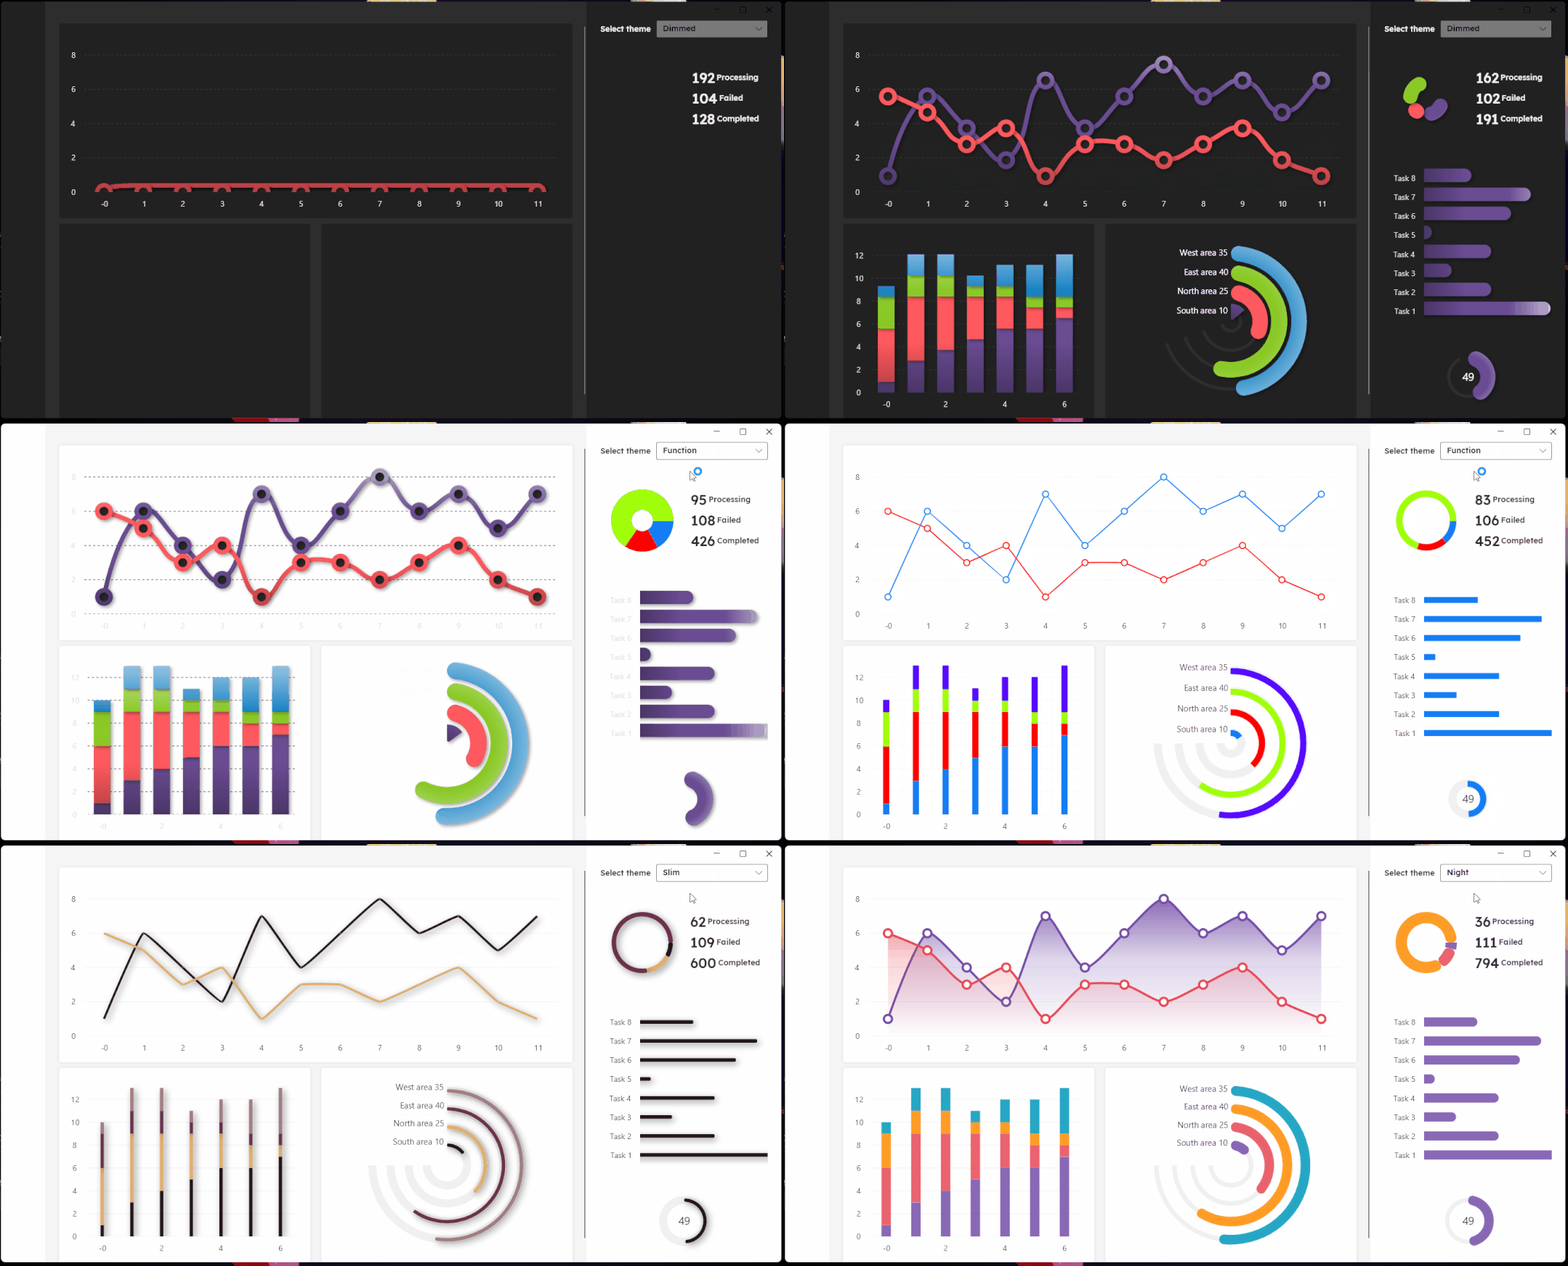
LiveCharts2 的特点之一是性能优异,它使用了一些优化技巧,比如数据虚拟化、图形缓存、异步绘制等,能够在大数据量下仍然能保持良好的响应速度和渲染性能。另外,它还提供了丰富的文档和示例,方便开发者快速入手和使用。
LiveCharts2 提供了多种类型的图表,包括折线图、面积图、柱状图、散点图、饼图等。同时,它还支持多个图表联动显示,支持动态更新数据、自定义样式和动画效果等功能。



LiveCharts 可以在不需要任何 UI 框架的情况下呈现图像,只要安装 SkiaSharp View 包,就可以在服务器端或控制台应用程序中构建图像,它可以从 NuGet 安装:
LiveChartsCore.SkiaSharpView
using LiveChartsCore;
using LiveChartsCore.Geo;
using LiveChartsCore.SkiaSharpView;
using LiveChartsCore.SkiaSharpView.Drawing.Geometries;
using LiveChartsCore.SkiaSharpView.SKCharts;

var cartesianChart = new SKCartesianChart
{
    Width = 900,
    Height = 600,
    Series = new ISeries[]
    {
        new LineSeries<int> { Values = new int[] { 1, 5, 4, 6 } },
        new ColumnSeries<int> { Values = new int[] { 4, 8, 2, 4 } }
    }
};

// you can save the image to png (by default)
// or use the second argument to specify another format.
cartesianChart.SaveImage("cartesianChart.png");

var pieChart = new SKPieChart
{
    Width = 900,
    Height = 600,
    Series = new ISeries[]
    {
        new PieSeries<int> { Values = new int[] { 10, } },
        new PieSeries<int> { Values = new int[] { 6 } },
        new PieSeries<int> { Values = new int[] { 4 } }
    }
};

pieChart.SaveImage("pieChart.png");

var geoHeatMap = new SKGeoMap
{
    Width = 900,
    Height = 600,
    Series = new IGeoSeries[]
    {
        new HeatLandSeries
        {
            Lands = new HeatLand[]
            {
                new() { Name = "mex", Value = 10 },
                new() { Name = "usa", Value = 15 },
                new() { Name = "can", Value = 8 }
            }
        }
    }
};

geoHeatMap.SaveImage("geoHeatMap.png");

// alternatively you can get the image and do different operations:
using var image = cartesianChart.GetImage();
using var data = image.Encode();
var base64CartesianChart = Convert.ToBase64String(data.AsSpan());

Console.WriteLine("Images saved at the root folder!");
