一:背景
1. 讲故事
前些天有位朋友微信上找到我,说他们学校的Web系统内存一直下不去,让我看下到底是怎么回事,老规矩让朋友生成一个dump文件丢给我,看一下便知。.
二:WinDbg 分析
1. 托管还是非托管
要想看托管还是非托管,可以用 !address -summary 观察下内存段。
0:000> !address -summary

--- Usage Summary ---------------- RgnCount ----------- Total Size -------- %ofBusy %ofTotal
Free                                    384     7dbe`3d662000 ( 125.743 TB)           98.24%
<unknown>                              9653      241`9e9fd000 (   2.256 TB)  99.98%    1.76%
Stack                                   153        0`125d0000 ( 293.812 MB)   0.01%    0.00%
Image                                  1912        0`0b0f2000 ( 176.945 MB)   0.01%    0.00%
Heap                                    110        0`0669a000 ( 102.602 MB)   0.00%    0.00%
Other                                    12        0`001ce000 (   1.805 MB)   0.00%    0.00%
TEB                                      51        0`00066000 ( 408.000 kB)   0.00%    0.00%
PEB                                       1        0`00001000 (   4.000 kB)   0.00%    0.00%

--- State Summary ---------------- RgnCount ----------- Total Size -------- %ofBusy %ofTotal
MEM_FREE                                384     7dbe`3d662000 ( 125.743 TB)           98.24%
MEM_RESERVE                            2794      23f`666dd000 (   2.248 TB)  99.59%    1.76%
MEM_COMMIT                             9098        2`5c2b1000 (   9.440 GB)   0.41%    0.01%
从卦中信息的 MEM_COMMIT 和 Heap 来看,应该就是托管内存的问题了。
2. 托管堆排查
要查看托管堆,可以用 !eeheap -gc 观察下。
0:000> !eeheap -gc

========================================
Number of GC Heaps: 8
----------------------------------------
Heap 0 (00000273748727a0)
Small object heap
         segment            begin        allocated        committed allocated size       committed size
generation 0:
    02b388ff24f0     027615400020     0276157f76f8     027615800000 0x3f76d8 (4159192)   0x400000 (4194304)
...
generation 1:
    02b388ff5e00     02762a000020     02762a01e460     02762a0b0000 0x1e440 (123968)     0xb0000 (720896)
generation 2:
    02b388f81840     027385000020     0273853a2b20     027385400000 0x3a2b00 (3812096)   0x400000 (4194304)
    02b388f818f0     027385400020     0273857ee220     027385800000 0x3ee200 (4121088)   0x400000 (4194304)
    02b388f81e70     027387400020     0273877914e8     0273877b2000 0x3914c8 (3740872)   0x3b2000 (3874816)
    02b388f823f0     027389400020     0273897bf580     0273897df000 0x3bf560 (3929440)   0x3df000 (4059136)
    02b388f82600     02738a000020     02738a3644e0     02738a368000 0x3644c0 (3556544)   0x368000 (3571712)
    ...
    02b388f85fc0     02739f000020     02739f253e10     02739f257000 0x253df0 (2440688)   0x257000 (2453504)
    02b388f861d0     02739fc00020     02739fffc9f0     02739ffff000 0x3fc9d0 (4180432)   0x3ff000 (4190208)
    02b388f86490     0273a0c00020     0273a0f829c0     0273a0fbd000 0x3829a0 (3680672)   0x3bd000 (3919872)
    02b388f87040     0273a5000020     0273a5332f78     0273a5337000 0x332f58 (3354456)   0x337000 (3371008)
    02b388f875c0     0273a7000020     0273a72e4710     0273a7305000 0x2e46f0 (3032816)   0x305000 (3166208)
    ...
Large object heap
         segment            begin        allocated        committed allocated size       committed size
    02b388f84f40     027399000020     02739908f520     027399090000 0x8f500 (587008)     0x90000 (589824)
Pinned object heap
         segment            begin        allocated        committed allocated size       committed size
    02b388f812c0     027383000020     02738300b080     027383011000 0xb060 (45152)       0x11000 (69632)
------------------------------
GC Allocated Heap Size:    Size: 0x2212923b0 (9146278832) bytes.
GC Committed Heap Size:    Size: 0x23b676000 (9586565120) bytes.
从卦中看当前的托管内存是 9.5G,通过观察内存都是被 Gen2 给吃掉了,那 Gen2 上都是什么对象呢?我们用 !dumheap -stat 观察下。
0:000> !dumpheap -stat
Statistics:
          MT     Count     TotalSize Class Name
...
7ff954ecd918    91,030     9,467,120 System.Reflection.RuntimeMethodInfo
7ff95701c8f0   572,034    18,305,088 System.Globalization.DateTimeFormatInfo+TokenHashValue
7ff954c9fd00 1,010,024    62,198,216 System.String
7ff95502fc10    62,645   173,045,678 System.Byte[]
0273747f9610    28,313 8,761,969,520 Free
Total 3,305,047 objects, 9,143,856,580 bytes
不看卦不知道,一看吓一跳,9G的内存,Free 就吃掉了 8.7G,看样子又是经典的 内存碎片化 了,赶紧到 Gen2 上去看一看狼狈现场。
0:000> !dumpheap 02739fc00020 02739fffc9f0
         Address               MT           Size
    02739fc00020     0273747f9610        717,136 Free
    02739fcaf170     7ff95502fc10          8,216
    02739fcb1188     7ff955478798             64
    02739fcb11c8     0273747f9610        607,864 Free
    02739fd45840     7ff95502fc10          8,216
    02739fd47858     7ff955478798             64
    02739fd47898     0273747f9610      2,205,336 Free
    02739ff61f30     7ff95502fc10          8,216
    02739ff63f48     7ff955478798             64
    02739ff63f88     0273747f9610         99,736 Free
    02739ff7c520     7ff95502fc10          8,216
    02739ff7e538     7ff955478798             64
    02739ff7e578     0273747f9610         76,504 Free
    02739ff91050     7ff95502fc10          8,216
    02739ff93068     7ff955478798             64
    02739ff930a8     0273747f9610        355,728 Free
    02739ffe9e38     7ff95502fc10          8,216
    02739ffebe50     7ff955478798             64
    02739ffebe90     0273747f9610         60,168 Free
    02739fffa998     7ff95502fc10          8,216
    02739fffc9b0     7ff955478798             64

Statistics:
          MT Count TotalSize Class Name
7ff955478798     7       448 System.IO.FileSystemWatcher+AsyncReadState
7ff95502fc10     7    57,512 System.Byte[]
0273747f9610     7 4,122,472 Free
Total 21 objects, 4,180,432 bytes
...
卦中信息是明显的 内存碎片化 现象,可以看到每一个 Free 后面都跟着一个 8216,那这玩意是干嘛的,为什么它不会 GC 回收呢?
3. 碎片化排查
要想找到不会回收的原因,我们用 !gcroot 看一下。
0:000> !gcroot 02739fffa998
Caching GC roots, this may take a while.
Subsequent runs of this command will be faster.

HandleTable:
    0000027374723fc0 (async pinned handle)
          -> 02739dc758c8     System.Threading.OverlappedData
          -> 02739fffa998     System.Byte[]
从卦中可以看到它是被 System.Threading.OverlappedData 持有,熟悉异步编程的朋友应该都知道IO完成端口,C# 中的 OverlappedData 还会绑定 handle,byte[],IOThread 等信息,我们挖一下其中的 _userState 。
0:000> !do 02739dc758c8
Name:        System.Threading.OverlappedData
Fields:
              MT    Field   Offset                 Type VT     Attr            Value Name
00007ff95502bce0  4000b00        8  System.IAsyncResult  0 instance 0000000000000000 _asyncResult
00007ff954af93b0  4000b01       10        System.Object  0 instance 000002739dc75910 _callback
00007ff95547f208  4000b02       18 ...eading.Overlapped  0 instance 000002739dc75880 _overlapped
00007ff954af93b0  4000b03       20        System.Object  0 instance 000002739fffa998 _userObject
00007ff954c9ac30  4000b04       28                  PTR  0 instance 000002b41023f130 _pNativeOverlapped
00007ff954c99250  4000b05       30        System.IntPtr  1 instance 0000000000000000 _eventHandle
00007ff954c1e8c0  4000b06       38         System.Int32  1 instance                0 _offsetLow
00007ff954c1e8c0  4000b07       3c         System.Int32  1 instance                0 _offsetHigh

0:000> !do 000002739dc75880
Name:        System.Threading.ThreadPoolBoundHandleOverlapped
Fields:
              MT    Field   Offset                 Type VT     Attr            Value Name
00007ff95547f558  4000b08        8 ...ng.OverlappedData  0 instance 000002739dc758c8 _overlappedData
00007ff955478d48  4000d2f       10 ...ompletionCallback  0 instance 00000273869e27a8 _userCallback
00007ff954af93b0  4000d30       18        System.Object  0 instance 000002739fffc9b0 _userState
00007ff9554791a8  4000d31       20 ...locatedOverlapped  0 instance 000002739dc75860 _preAllocated
00007ff954c9ac30  4000d32       30                  PTR  0 instance 000002b41023f130 _nativeOverlapped
00007ff955479790  4000d33       28 ...adPoolBoundHandle  0 instance 0000000000000000 _boundHandle
00007ff954c1b3c0  4000d34       38       System.Boolean  1 instance                0 _completed
00007ff955478d48  4000d2e      930 ...ompletionCallback  0   static 00000273869e2898 s_completionCallback

0:000> !do 000002739fffc9b0
Name:        System.IO.FileSystemWatcher+AsyncReadState
Fields:
              MT    Field   Offset                 Type VT     Attr            Value Name
00007ff954c1e8c0  400002b       30         System.Int32  1 instance                1 <Session>k__BackingField
00007ff95502fc10  400002c        8        System.Byte[]  0 instance 000002739fffa998 <Buffer>k__BackingField
00007ff955026688  400002d       10 ...es.SafeFileHandle  0 instance 000002739dc757d8 <DirectoryHandle>k__BackingField
00007ff955479790  400002e       18 ...adPoolBoundHandle  0 instance 000002739dc75828 <ThreadPoolBinding>k__BackingField
00007ff9554791a8  400002f       20 ...locatedOverlapped  0 instance 000002739dc75860 <PreAllocatedOverlapped>k__BackingField
00007ff955479248  4000030       28 ...eSystem.Watcher]]  0 instance 000002739dc75848 <WeakWatcher>k__BackingField
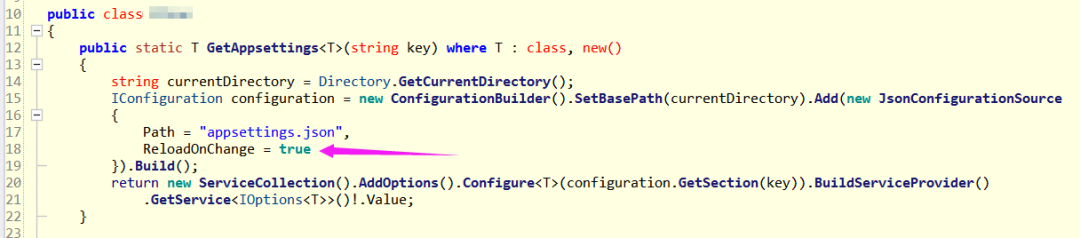
从卦中可以看到原来是 FileSystemWatcher 在作祟,说实话看到这个东西我马上就有条件反射,肯定又是经典的 ReloadOnChange=true 导致的,果然直觉就是对的,一搜代码果然有,截图如下:
三:总结
说实话 ReloadOnChange=true 真的是万恶之源,据往期分析可列出如下四大罪证:
-
文件句柄暴涨 -
byte[]导致的内存暴涨 -
pinned 导致的内存碎片化 -
线程池暴涨 导致的程序无响应
大家使用前需 慎之又慎,三思而后行!!!