流程图(Flowchart):使用图形表示算法的思路是一种极好的方法,因为千言万语不如一张图。流程图在汇编语言和早期的BASIC语言环境中得到应用。相关的还有一种PAD图,对PASCAL或C语言都极适用。
Flowchart 是一种通过文本方式描述的流程图,通过它你仅需几行代码即可在文档中绘制流程图。.
语法简介
Flowchart 的语法来源于 js-sequence-diagrams ,定义流程图分为下边两步。
定义流程图元素
name=>type: content:>url
name: 元素的名称
type:类型,包括如下类别:
• start
• end
• operation
• subroutine
• condition
• inputoutput
• parallel
content:文本内容
url:连接
示例:
st=>start: Start
e=>end
op1=>operation: My Operation
sub1=>subroutine: My Subroutine
cond=>condition: Yes
or No?:>http://www.google.com
io=>inputoutput: catch something
st->op1->cond
cond(yes)->io->e
cond(no)->sub1(right)->op1
连接元素
使用 -> 符号即可:
cond(yes)->io->e
cond(no)->op1->e
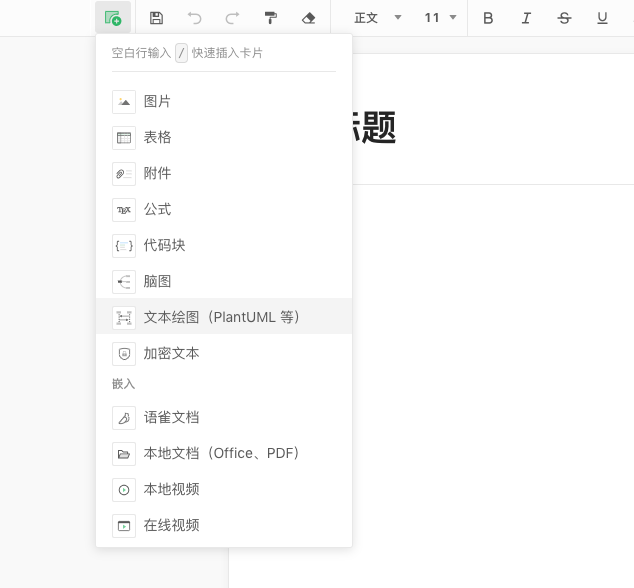
操作入口
插入卡片 -> 选择文本绘图 -> Flowchart
示例
示例 1 效果:
st=>start: Start:>http://www.google.com[blank]
e=>end:>http://www.google.com
op1=>operation: My Operation
sub1=>subroutine: My Subroutine
cond=>condition: Yes
or No?:>http://www.google.com
io=>inputoutput: catch something...
para=>parallel: parallel tasks

st->op1->cond
cond(yes)->io->e
cond(no)->para
para(path1, bottom)->sub1(right)->op1
para(path2, top)->op1
参考资料
https://flowchart.js.org/ https://bramp.github.io/js-sequence-diagrams/ https://blog.csdn.net/ethmery/article/details/50670294
在线地址:https://flowchart.fun/