-
框架使用大于等于
.NET40; -
Visual Studio 2022; -
项目使用 MIT 开源许可协议;
-
避免画线发虚DrawingContext绘制Line的时候会发虚,以下方法可以避免;.
 var d = Pen.Thickness / 2;
 var guidelines = new GuidelineSet(new[] { d }, new[] { d });
 drawingContext.PushGuidelineSet(guidelines);
 或者调用
 SnapDrawingExtensions.DrawSnappedLinesBetweenPoints
1) BasicBarChart.cs 代码如下;
using System;
using System.Collections.Generic;
using System.Linq;
using System.Windows;
using System.Windows.Controls;
using System.Windows.Media;

namespace WPFDevelopers.Controls
{
    public class BasicBarChart : Control
    {
        public static readonly DependencyProperty SeriesArrayProperty =
            DependencyProperty.Register("SeriesArray", typeof(IEnumerable<KeyValuePair<string, double>>),
                typeof(BasicBarChart), new UIPropertyMetadata(SeriesArrayChanged));


        static BasicBarChart()
        {
            DefaultStyleKeyProperty.OverrideMetadata(typeof(BasicBarChart),
                new FrameworkPropertyMetadata(typeof(BasicBarChart)));
        }

        public IEnumerable<KeyValuePair<string, double>> SeriesArray
        {
            get => (IEnumerable<KeyValuePair<string, double>>)GetValue(SeriesArrayProperty);
            set => SetValue(SeriesArrayProperty, value);
        }

        private static void SeriesArrayChanged(DependencyObject d, DependencyPropertyChangedEventArgs e)
        {
            var radarChart = d as BasicBarChart;
            if (e.NewValue != null)
                radarChart.InvalidateVisual();
        }

        protected override void OnRender(DrawingContext drawingContext)
        {
            //base.OnRender(drawingContext);
            if (SeriesArray == null || SeriesArray.Count() == 0)
                return;
            SnapsToDevicePixels = true;
            UseLayoutRounding = true;
            var brushConverter = new BrushConverter();
            var myPen = new Pen
            {
                Thickness = 1,
                Brush = (Brush)brushConverter.ConvertFromString("#6E7079")
            };
            myPen.Freeze();

            //var d = myPen.Thickness / 2;
            //var guidelines = new GuidelineSet(new[] { d }, new[] { d });
            //drawingContext.PushGuidelineSet(guidelines);

            var h = ActualHeight / 2 + 160;
            var w = ActualWidth / 2;
            var startX = w / 3;
            var width = SeriesArray.Count() * 120 + startX;
            //drawingContext.DrawLine(myPen, new Point(startX, h), new Point(width, h));
            var stratNum = 0;

            drawingContext.DrawSnappedLinesBetweenPoints(myPen, myPen.Thickness, new Point(startX, h),
                new Point(width, h));
            var formattedText = DrawingContextHelper.GetFormattedText(stratNum.ToString(),
                (Brush)brushConverter.ConvertFromString("#6E7079"), FlowDirection.LeftToRight);
            drawingContext.DrawText(formattedText,
                new Point(startX - formattedText.Width * 2 - 10, h - formattedText.Height / 2));
            var x = startX;
            //var y = h + d;
            var y = h + myPen.Thickness;
            var points = new List<Point>();
            var rectBrush = new SolidColorBrush((Color)ColorConverter.ConvertFromString("#5470C6"));
            for (var i = 0; i < SeriesArray.Count() + 1; i++)
            {
                //drawingContext.DrawLine(myPen, new Point(x, y), new Point(x, y + 4));
                points.Add(new Point(x, y));
                points.Add(new Point(x, y + 4));
                x = x + 120;
            }

            drawingContext.DrawSnappedLinesBetweenPoints(myPen, myPen.Thickness, points.ToArray());

            var xAxisPen = new Pen
            {
                Thickness = 1,
                Brush = (Brush)brushConverter.ConvertFromString("#E0E6F1")
            };
            xAxisPen.Freeze();
            var xAxis = h - 80;
            var max = Convert.ToInt32(SeriesArray.Max(kvp => kvp.Value));
            max = (max / 50 + (max % 50 == 0 ? 0 : 1)) * 50 / 50;
            var min = Convert.ToInt32(SeriesArray.Min(kvp => kvp.Value));
            points.Clear();
            for (var i = 0; i < max; i++)
            {
                //drawingContext.DrawLine(xAxisPen, new Point(startX, xAxis), new Point(width, xAxis));
                points.Add(new Point(startX, xAxis));
                points.Add(new Point(width, xAxis));
                stratNum += 50;
                formattedText = DrawingContextHelper.GetFormattedText(stratNum.ToString(),
                    (Brush)brushConverter.ConvertFromString("#6E7079"), FlowDirection.LeftToRight);
                drawingContext.DrawText(formattedText,
                    new Point(startX - formattedText.Width - 10, xAxis - formattedText.Height / 2));
                xAxis = xAxis - 80;
            }

            drawingContext.DrawSnappedLinesBetweenPoints(xAxisPen, xAxisPen.Thickness, points.ToArray());

            x = startX;
            var rectWidth = 85;
            var rectHeight = 0D;
            for (var i = 0; i < SeriesArray.Count(); i++)
            {
                formattedText = DrawingContextHelper.GetFormattedText(SeriesArray.ToList()[i].Key,
                    (Brush)brushConverter.ConvertFromString("#6E7079"), FlowDirection.LeftToRight);
                drawingContext.DrawText(formattedText, new Point(x + 120 / 2 - formattedText.Width / 2, y + 4));
                var _value = SeriesArray.ToList()[i].Value;
                //rectHeight = _value * 200;
                rectHeight = (_value - 0) / (stratNum - 0) * (80 * max);
                //rectHeight = (stratNum - _value) / 100 * stratNum;
                drawingContext.DrawRectangle(rectBrush, null,
                    new Rect(x + (120 - 85) / 2, h - rectHeight, rectWidth, rectHeight));
                x = x + 120;
            }
        }
    }
}
2) **BasicBarChartExample.xaml ** 代码如下;
<UserControl x:Class="WPFDevelopers.Samples.ExampleViews.BasicBarChartExample"
             xmlns="http://schemas.microsoft.com/winfx/2006/xaml/presentation"
             xmlns:x="http://schemas.microsoft.com/winfx/2006/xaml"
             xmlns:mc="http://schemas.openxmlformats.org/markup-compatibility/2006"
             xmlns:d="http://schemas.microsoft.com/expression/blend/2008"
             xmlns:local="clr-namespace:WPFDevelopers.Samples.ExampleViews"
             xmlns:wpfdev="https://github.com/WPFDevelopersOrg/WPFDevelopers"
             mc:Ignorable="d"
             d:DesignHeight="450" d:DesignWidth="800">
    <Grid Background="Gainsboro">
        <Border
            Height="500"
            Background="White"
            Margin="30,0">
            <Grid Margin="20,10">

                <Grid.RowDefinitions>
                    <RowDefinition Height="40" />
                    <RowDefinition />
                    <RowDefinition Height="auto" />
                </Grid.RowDefinitions>
                <WrapPanel HorizontalAlignment="Right">
                    <Rectangle
                        Width="6"
                        Height="26"
                        Fill="Black" />
                    <TextBlock
                        Padding="10,0"
                        FontSize="24"
                        FontWeight="Black"
                        Text="{Binding KeyBarChart, RelativeSource={RelativeSource AncestorType=local:BasicBarChartExample}}" />
                </WrapPanel>
                <wpfdev:BasicBarChart
                     Grid.Row="1"
                    SeriesArray="{Binding SeriesModels, RelativeSource={RelativeSource AncestorType=local:BasicBarChartExample}}"/>
                <Button
                    Grid.Row="2"
                    Width="200"
                    VerticalAlignment="Bottom"
                    Click="Button_Click"
                    Content="刷新"
                    Style="{StaticResource PrimaryButton}" />
            </Grid>
        </Border>
    </Grid>
</UserControl>
2) BasicBarChartExample .xaml.cs 代码如下;
using System;
using System.Collections.Generic;
using System.Linq;
using System.Text;
using System.Windows;
using System.Windows.Controls;
using System.Windows.Data;
using System.Windows.Documents;
using System.Windows.Input;
using System.Windows.Media;
using System.Windows.Media.Imaging;
using System.Windows.Navigation;
using System.Windows.Shapes;
namespace WPFDevelopers.Samples.ExampleViews
{
/// <summary>
/// BasicBarChartExample.xaml 的交互逻辑
/// </summary>
public partial class BasicBarChartExample : UserControl
{
public IEnumerable<KeyValuePair<string, double>> SeriesModels
{
get { return (IEnumerable<KeyValuePair<string, double>>)GetValue(SeriesModelsProperty); }
set { SetValue(SeriesModelsProperty, value); }
}
public static readonly DependencyProperty SeriesModelsProperty =
DependencyProperty.Register("SeriesModels", typeof(IEnumerable<KeyValuePair<string, double>>), typeof(BasicBarChartExample), new PropertyMetadata(null));
Dictionary<string, IEnumerable<KeyValuePair<string, double>>> keyValues = new Dictionary<string, IEnumerable<KeyValuePair<string, double>>>();
public string KeyBarChart
{
get { return (string)GetValue(KeyBarChartProperty); }
set { SetValue(KeyBarChartProperty, value); }
}
public static readonly DependencyProperty KeyBarChartProperty =
DependencyProperty.Register("KeyBarChart", typeof(string), typeof(BasicBarChartExample), new PropertyMetadata(null));
private int _index = 0;
public BasicBarChartExample()
{
InitializeComponent();
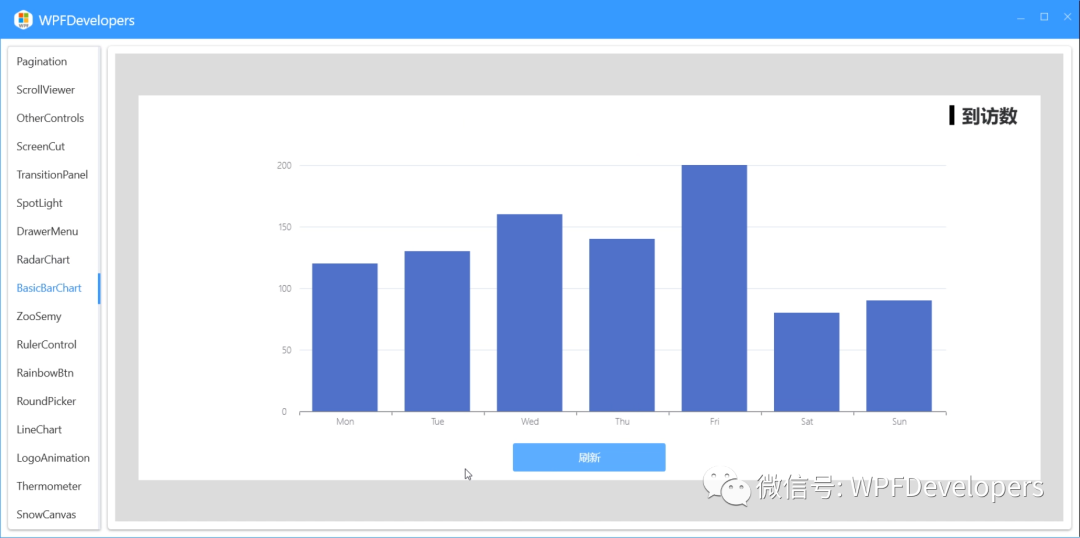
var Models1 = new[]
{
new KeyValuePair<string, double>("Mon", 120),
new KeyValuePair<string, double>("Tue", 130),
new KeyValuePair<string, double>("Wed", 160),
new KeyValuePair<string, double>("Thu", 140),
new KeyValuePair<string, double>("Fri", 200) ,
new KeyValuePair<string, double>("Sat", 80) ,
new KeyValuePair<string, double>("Sun", 90) ,
};
keyValues.Add("到访数", Models1);
var Models2 = new[]
{
new KeyValuePair<string, double>("蛐蛐", 120),
new KeyValuePair<string, double>("常威", 170),
new KeyValuePair<string, double>("来福", 30),
new KeyValuePair<string, double>("包龙星", 200),
new KeyValuePair<string, double>("包有为", 100) ,
new KeyValuePair<string, double>("雷豹", 180) ,
new KeyValuePair<string, double>("方唐镜", 90) ,
};
keyValues.Add("能力值", Models2);
SeriesModels = keyValues.ToList()[0].Value;
KeyBarChart = keyValues.ToList()[0].Key;
}
private void Button_Click(object sender, RoutedEventArgs e)
{
_index++;
if (_index >= keyValues.Count)
{
_index = 0;
}
SeriesModels = keyValues.ToList()[_index].Value;
KeyBarChart = keyValues.ToList()[_index].Key;
}
}
}